


SO, WHO IS ALICE?
ALICE is an acronym for Asset Limited, Income Constrained, Employed.
ALICE families and individuals are those who make more than the federal poverty level, but less than the ALICE Threshold, which is what is needed to afford the basic necessities of food, housing, childcare, transportation and healthcare.
In 2023, 44% of households in Black Hawk County could not afford basic needs such as housing, childcare, food, transportation, and healthcare.
We come into contact with ALICE individuals each and every day. These hardworking individuals and families live paycheck to paycheck with no extra money to set aside for savings. ALICE cannot always pay the bills, has little or nothing in savings and is forced to make tough choices each day such as deciding between quality childcare or paying the rent. One unexpected car repair bill or medical bill can push these financially-strapped families over the edge.
The future success of our communities is directly tied to the financial stability of these fragile ALICE households.
The ALICE Household Survival Budget is the foundation of the ALICE research. This budget calculates the bare-minimum cost of the household basics needed to live and work in the modern economy by household composition, in every county.
When compared to the more accurate cost of living included in the Household Survival Budget, the Federal Poverty Level (FPL) is drastically inadequate. Unlike the ALICE budgets, the FPL is not based on the cost of contemporary household necessities, and except for Alaska and Hawaii, it is not adjusted to reflect cost-of-living differences. Nor does it adjust for different ages of household members. The FPL is increased annually based on the Bureau of Labor Statistics' (BLS) Consumer Price Index (CPI), and those increases are the same for all U.S. households of a given size. By contrast, the actual household costs in the Survival Budget have increased at different rates depending on location, household size and household composition.
Yet, despite its inadequacies, the FPL continues to be the standard for determining the number and proportion of people living in poverty in the U.S. With the FPL as the primary way for policymakers and local stakeholders to gauge the extent of financial hardship in their communities, a huge portion of struggling U.S. households go unrecognized.
Across Iowa, for all household sizes and in all locations, the FPL is well below the Household Survival Budget. In 2023, the FPL was $30,000 for a family of four ($14,580 for a single adult). In contrast, Figure 1 shows that the average cost of living for a family of four in Iowa was $66,096 - considerably higher than the FPL - and average household costs for a single adult were also substantially higher. Cost increases in the Household Survival Budget were driven by housing, food and healthcare.

Census income thresholds link from above chart: https://www.census.gov/topics/income-poverty/poverty/guidance/poverty-measures.html

Links from above image:
Household Survival Budget for other household compositions at the state and county levels - http://unitedforalice.org/Household-Budgets/Iowa
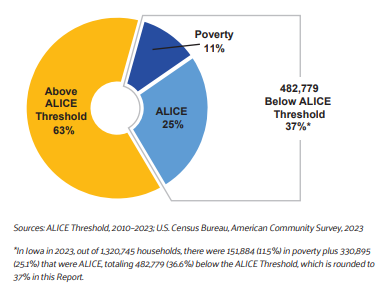 According to the FPL, 11% of households in Iowa (151,884) were in poverty in 2023. Yet United for ALICE data shows that another 25% (330,895) households - more than twice as many - were ALICE (Asset Limited, Income Constrained, Employed). ALICE households earn above the FPL, but not enough to afford the basics in the communities where they live.
The reality is that of the 1.3 million households in Iowa, 482,779 - 37%* - had income below the ALICE Threshold of Financial Survival in 2023. These included both households in poverty and ALICE households.
Stable households, stronger communities. If all households in Iowa had enough income to meet their basic needs, not only would households' hardship be eased, but there would be a positive economic impact on the wider community through increased consumer spending and contributions to the tax base.
KEY FINDINGS OF THE ALICE REPORT INCLUDE:
- Financial hardship over time: ALICE households are especially vulnerable to national economic disruptions. The number of households below the ALICE Threshold in Iowa increased dramatically through the Great Recession (2007-2010) and continued to increase through 2018. By 2019, that number had just started to fall - and then the pandemic hit. From 2019 to 2021, the total number of households increased by 1% and the number of households below the Threshold increased by 5%.
- Demographics: There are households below the ALICE Threshold across all demographic groups. But for example, by race/ethnicity, 61% of Black and 46% of Hispanic households were below the Threshold in Iowa in 2021, compared to 34% of white households. Be age of householder, the youngest (under age 25) and oldest (age 65+) households faced the hardest rates of hardship. And by household composition, single-parent families with children were more likely to be below the Threshold than married-parent households or single/cohabitating households without children.
- Work and wages: Of the 20 most common occupations in Iowa in 2021, 70% paid less than $20 per hour. Most of these saw an increase in the median wage; for example, the median wage for driver/sales workers and truck drivers increased 15% to $20.77 per hour statewide in 2021.But given that wages had stagnated for a decade, many top jobs still had a substantial percentage of workers who lived below the ALICE Threshold in 2021.
- Pandemic assistance: Public assistance programs were temporarily expanded in 2021, but not enough to bring most households below the ALICE Threshold to financial stability. In Iowa, a family of four with two parents working full-time in two of the most common occupations (retail salesperson and cashier) could not afford the Household Survival Budget in 2021, even with the expanded Child Tax Credit, the Child and Dependent Care Tax Credit and the Economic Impact Payments.
- Savings and assets: While savings rates were increasing on average in Iowa, rates differed by income. According to SHED, only 47% of households below the ALICE Threshold had emergency savings or rainy day funds in October 2019, compared to 68% of thresholds above the Threshold. By November 2021, the rate for households below the Threshold had increased slightly to 48%, as had the rate for households above the threshold (to 69%). Similarly, only 42% of households below the Threshold had retirement assets in 2021, compared to 70% of those above.
- Beyond 2021: With pandemic assistance waning while significant challenges remain, there are warning signs that the economic situation for households below the ALICE Threshold has worsened since 2021, including sustained high levels of food insufficiency, feelings of anxiety and depression, continued difficulty paying bills, increased medical debt and reduced savings.


RAINY DAY FUNDS:

RETIREMENT ASSETS:


Iowa • State Overview
United For ALICE calculates the cost of household essentials for all counties in Iowa. These costs, outlined in the Household Survival Budget, are calculated for various household sizes and compositions.
Of Iowa's 1,293,028 households in 2021…
- 11% earned below the Federal Poverty Level (FPL)
- 24% were ALICE, in households that earned above the FPL but not enough to afford the basics in the communities where they live
- Together, 36% of households in Iowa were below the ALICE Threshold (poverty + ALICE divided by total households)

While the COVID-19 pandemic brought employment shifts, health struggles, and school/business closures in 2021, it also spurred unprecedented public assistance through pandemic relief measures. In 2019, 439,443 households in Iowa were below the ALICE Threshold; by 2021, that number had changed to 459,444.

See this data — and more — for all Iowa counties on the County Reports page.
ALICE Lives in Every Community
ALICE lives in rural, urban, and suburban areas across the state. ALICE household data for Iowa is available by County (see map below), ZIP code, Census Designated Place, and County Subdivision (on the Maps page) and by Legislative District. You can also compare states and explore national-level data on the National Overview page or download an Excel version of this data.

Household Type: All Households
| County | Households | % Below ALICE Threshold |
|---|
| Adair | 3,180 | 38% |
| Adams | 1,529 | 42% |
| Allamakee | 5,814 | 36% |
| Appanoose | 4,920 | 47% |
| Audubon | 2,498 | 38% |
| Benton | 10,075 | 29% |
| Black Hawk | 53,951 | 41% |
| Boone | 10,720 | 34% |
| Bremer | 9,638 | 29% |
| Buchanan | 7,787 | 33% |
| Buena Vista | 7,506 | 42% |
| Butler | 5,860 | 35% |
| Calhoun | 3,932 | 41% |
| Carroll | 8,761 | 37% |
| Cass | 5,777 | 40% |
| Cedar | 7,381 | 30% |
| Cerro Gordo | 19,569 | 36% |
| Cherokee | 5,126 | 34% |
| Chickasaw | 5,005 | 35% |
| Clarke | 3,740 | 39% |
| Clay | 7,137 | 44% |
| Clayton | 7,319 | 40% |
| Clinton | 19,103 | 37% |
| Crawford | 6,159 | 43% |
| Dallas | 37,970 | 30% |
| Davis | 3,150 | 32% |
| Decatur | 3,053 | 46% |
| Delaware | 6,944 | 32% |
| Des Moines | 17,042 | 40% |
| Dickinson | 8,096 | 25% |
| Dubuque | 40,482 | 33% |
| Emmet | 3,856 | 38% |
| Fayette | 8,107 | 43% |
| Floyd | 6,712 | 41% |
| Franklin | 4,108 | 39% |
| Fremont | 2,742 | 36% |
| Greene | 3,790 | 39% |
| Grundy | 5,024 | 30% |
| Guthrie | 4,463 | 37% |
| Hamilton | 5,993 | 37% |
| Hancock | 4,610 | 32% |
| Hardin | 7,033 | 38% |
| Harrison | 5,932 | 35% |
| Henry | 7,565 | 39% |
| Howard | 3,708 | 39% |
| Humboldt | 4,189 | 34% |
| Ida | 2,951 | 37% |
| Iowa | 6,765 | 34% |
| Jackson | 8,020 | 36% |
| Jasper | 14,370 | 35% |
| Jefferson | 6,688 | 45% |
| Johnson | 61,301 | 35% |
| Jones | 8,053 | 35% |
| Keokuk | 4,136 | 41% |
| Kossuth | 6,422 | 36% |
| Lee | 14,068 | 40% |
| Linn | 94,884 | 32% |
| Louisa | 4,043 | 37% |
| Lucas | 3,614 | 40% |
| Lyon | 4,364 | 31% |
| Madison | 6,377 | 36% |
| Mahaska | 8,813 | 37% |
| Marion | 13,241 | 30% |
| Marshall | 15,298 | 38% |
| Mills | 5,301 | 32% |
| Mitchell | 4,400 | 35% |
| Monona | 3,786 | 38% |
| Monroe | 2,998 | 32% |
| Montgomery | 4,380 | 40% |
| Muscatine | 16,785 | 38% |
| O'Brien | 5,670 | 38% |
| Osceola | 2,659 | 30% |
| Page | 6,171 | 47% |
| Palo Alto | 3,685 | 36% |
| Plymouth | 10,191 | 27% |
| Pocahontas | 3,121 | 38% |
| Polk | 203,390 | 32% |
| Pottawattamie | 37,930 | 39% |
| Poweshiek | 7,820 | 39% |
| Ringgold | 1,860 | 43% |
| Sac | 4,196 | 34% |
| Scott | 72,128 | 35% |
| Shelby | 4,918 | 36% |
| Sioux | 12,284 | 32% |
| Story | 38,868 | 39% |
| Tama | 6,655 | 39% |
| Taylor | 2,446 | 36% |
| Union | 4,936 | 45% |
| Van Buren | 2,858 | 42% |
| Wapello | 14,120 | 43% |
| Warren | 19,517 | 33% |
| Washington | 8,833 | 35% |
| Wayne | 2,536 | 42% |
| Webster | 15,659 | 41% |
| Winnebago | 4,473 | 36% |
| Winneshiek | 8,156 | 33% |
| Woodbury | 41,327 | 41% |
| Worth | 3,164 | 34% |
| Wright | 5,343 | 41% |
See maps with additional locations and topics on the Maps page.
ALICE Households are Diverse, but Financial Hardship is Not Equally Distributed
ALICE households are as diverse as the communities they live in. ALICE household data is available at the state and county levels by race/ethnicity, household composition (families with children, single households), and age of householder. Exploring the demographics of financial hardship highlights inequities in the state and local economy.
For example, the figure below shows the substantial disparities in financial hardship that exist by race/ethnicity.
Households by Race/Ethnicity, Iowa, 2021

View more demographic data — including data by household type and age of householder for the state and counties — on the Demographics page.
ALICE Works Hard, But It’s Not Enough
A key contributor to the number of ALICE households in Iowa is the fundamental mismatch between the cost of living and what jobs pay. For example, 19% of Driver/Sales Workers And Truck Drivers (the most common occupation in Iowa) were below the ALICE Threshold in 2021.
Top Occupations, Employment, Wages, and Percentage Below ALICE Threshold, Iowa, 2021
| OCCUPATION | Total Employment (BLS) |
Median Hourly Wage (BLS) |
Percent Median Wage Change From 2019 (BLS) |
Percent Workers Below ALICE Threshold (ACS PUMS) |
|---|
| Driver/Sales Workers And Truck Drivers | 52,000 | $20.77 | 15% | 19% |
| Cashiers | 44,580 | $11.29 | 5% | 36% |
| Retail Salespersons | 37,530 | $13.49 | 17% | 27% |
| Fast Food And Counter Workers | 33,010 | $11.17 | 10% | 46% |
| General And Operations Managers | 32,670 | $36.99 | -7% | 14% |
| Registered Nurses | 32,650 | $29.71 | 4% | 7% |
| Customer Service Representatives | 29,090 | $18.00 | 4% | 22% |
| Laborers And Freight, Stock, And Material Movers, Hand | 28,740 | $17.88 | 12% | 32% |
| Cooks | 27,330 | $13.34 | 11% | 34% |
| Office Clerks, General | 26,800 | $17.74 | 7% | 21% |
2021 Point-in-Time Data
Population: 130,368 | Number of Households: 53,951 (4% change from 2019)
Median Household Income: $60,264 (state average: $65,600)
Labor Force Participation Rate: 66% (state average: 66%)
ALICE Households: 26% (state average: 24%)
Households in Poverty: 15% (state average 11%)


The above information was obtained from the 2025 United Ways of Iowa ALICE Report, which can be found by clicking here or by visiting https://www.unitedforalice.org/state-overview/Iowa.